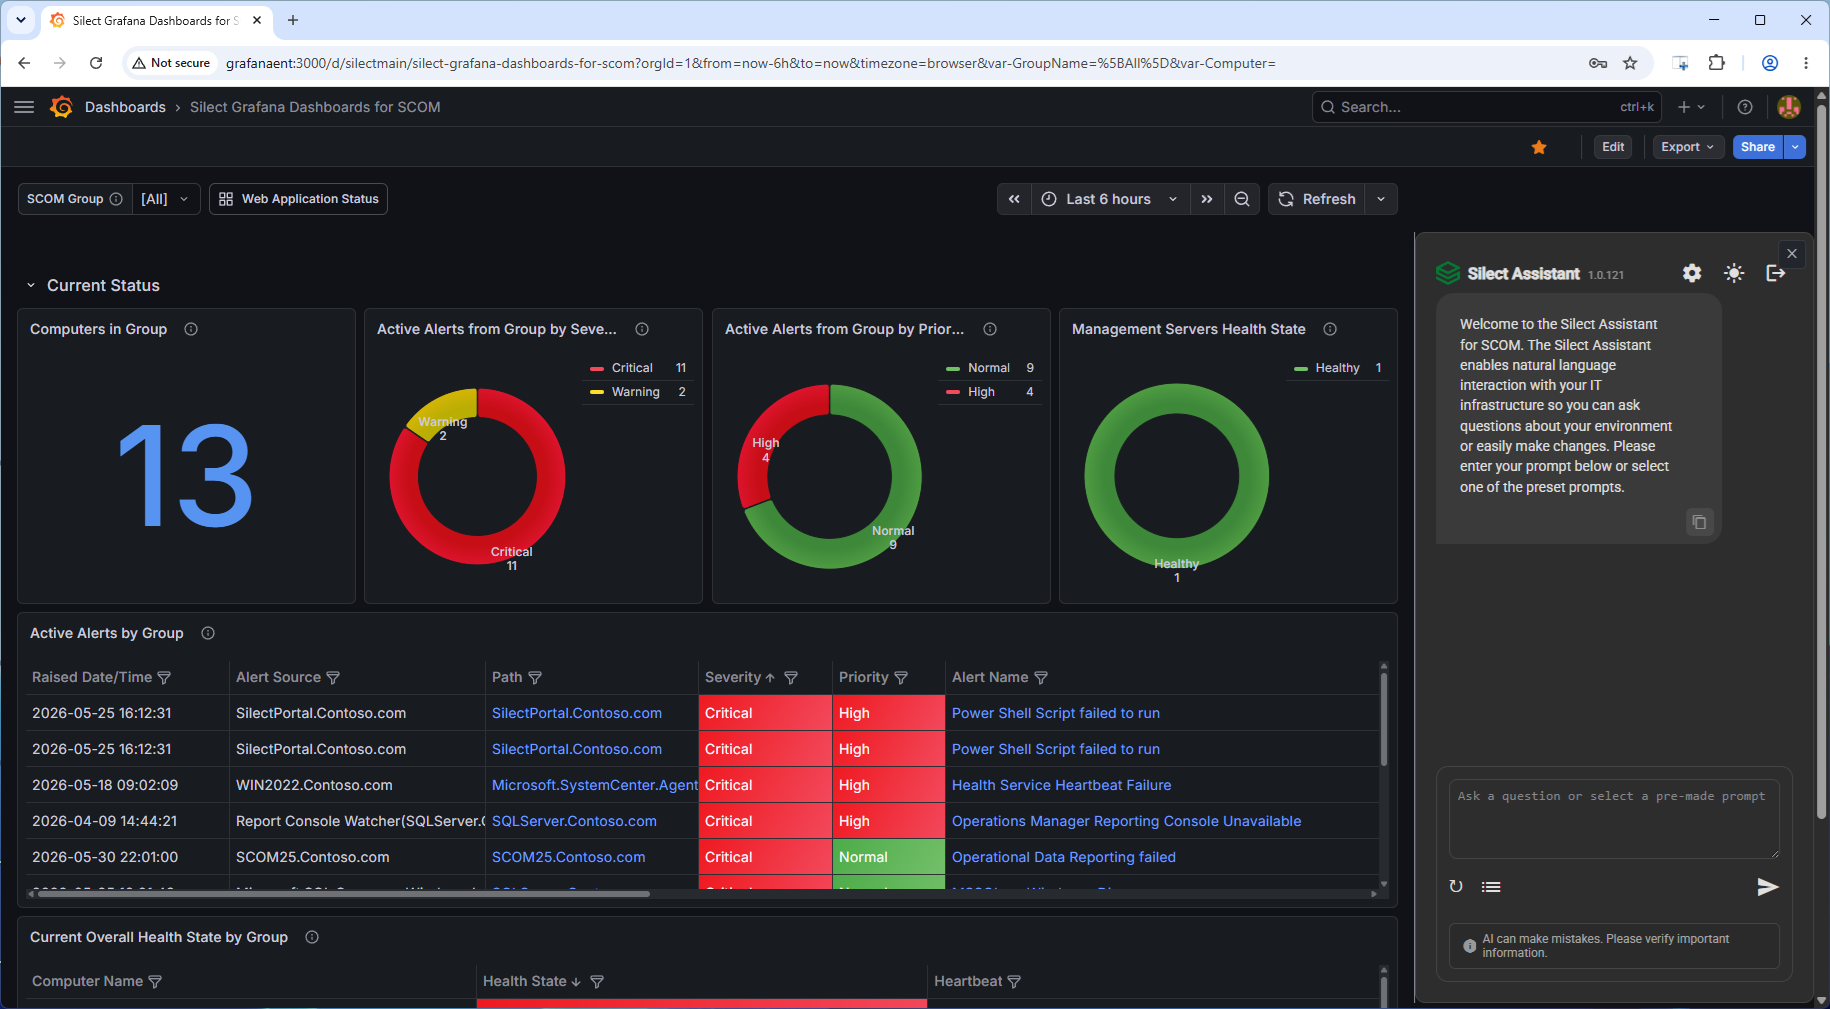
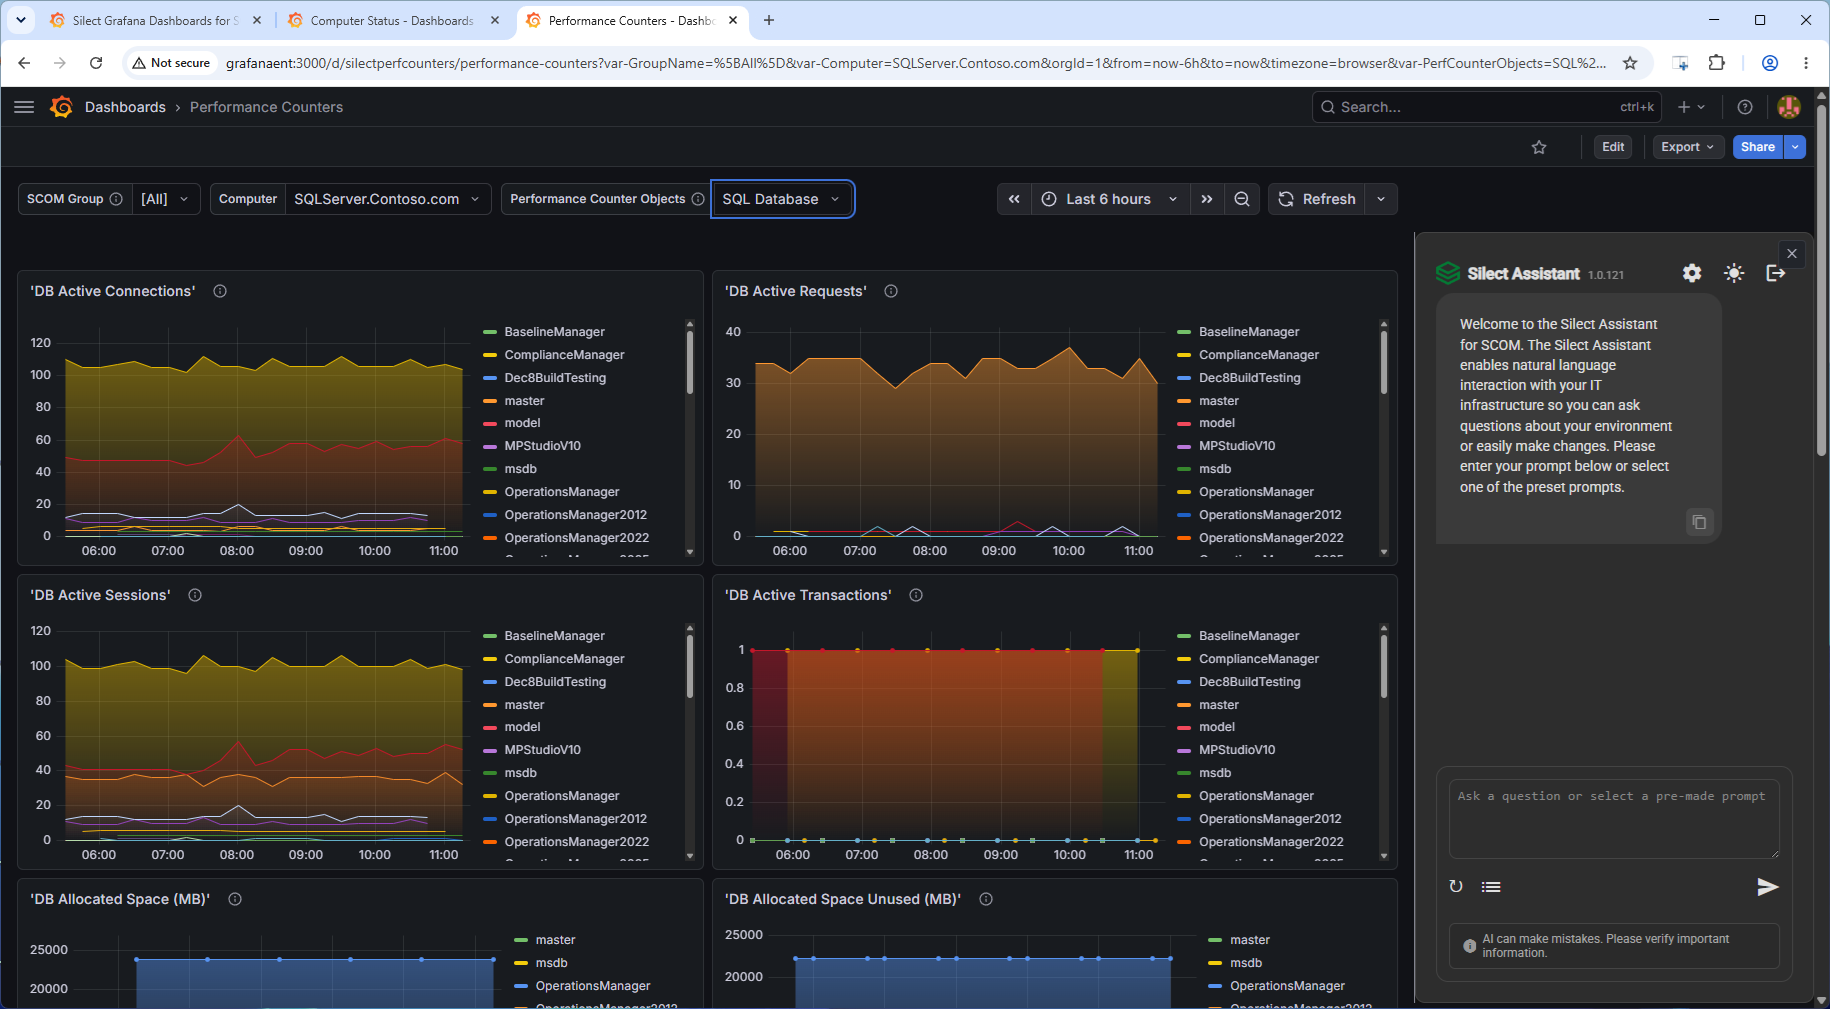
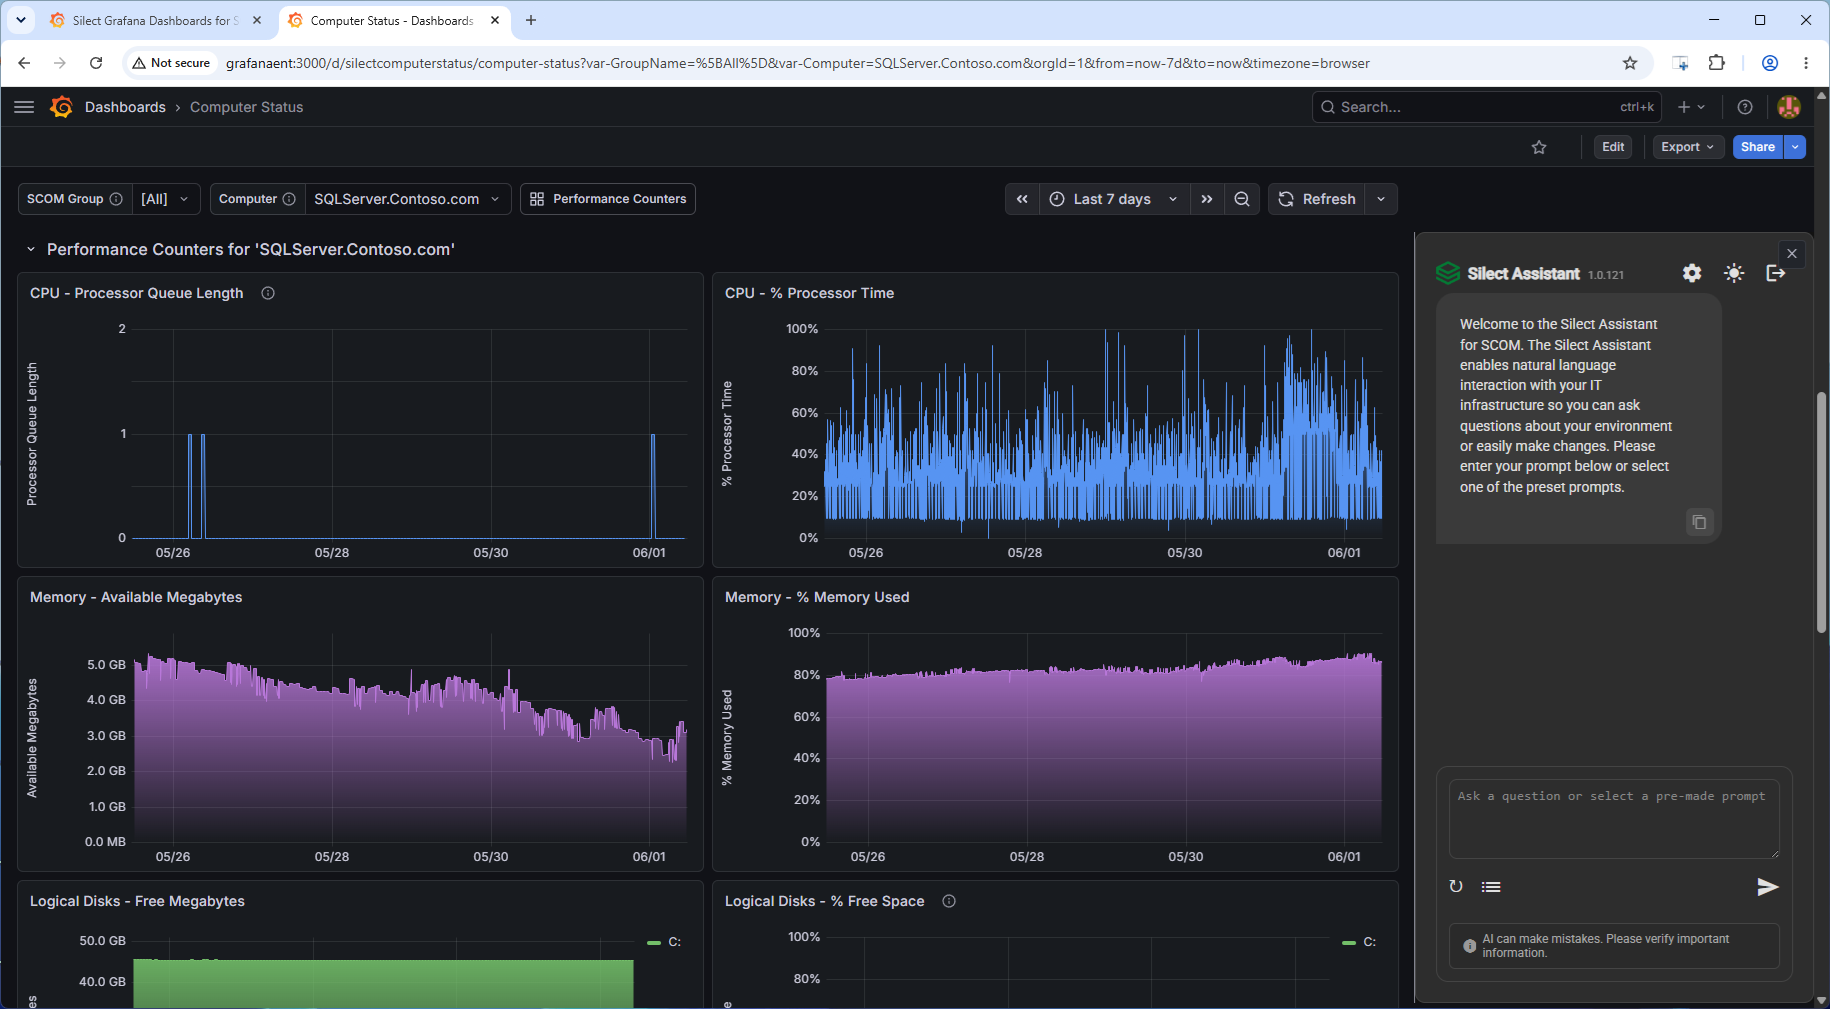
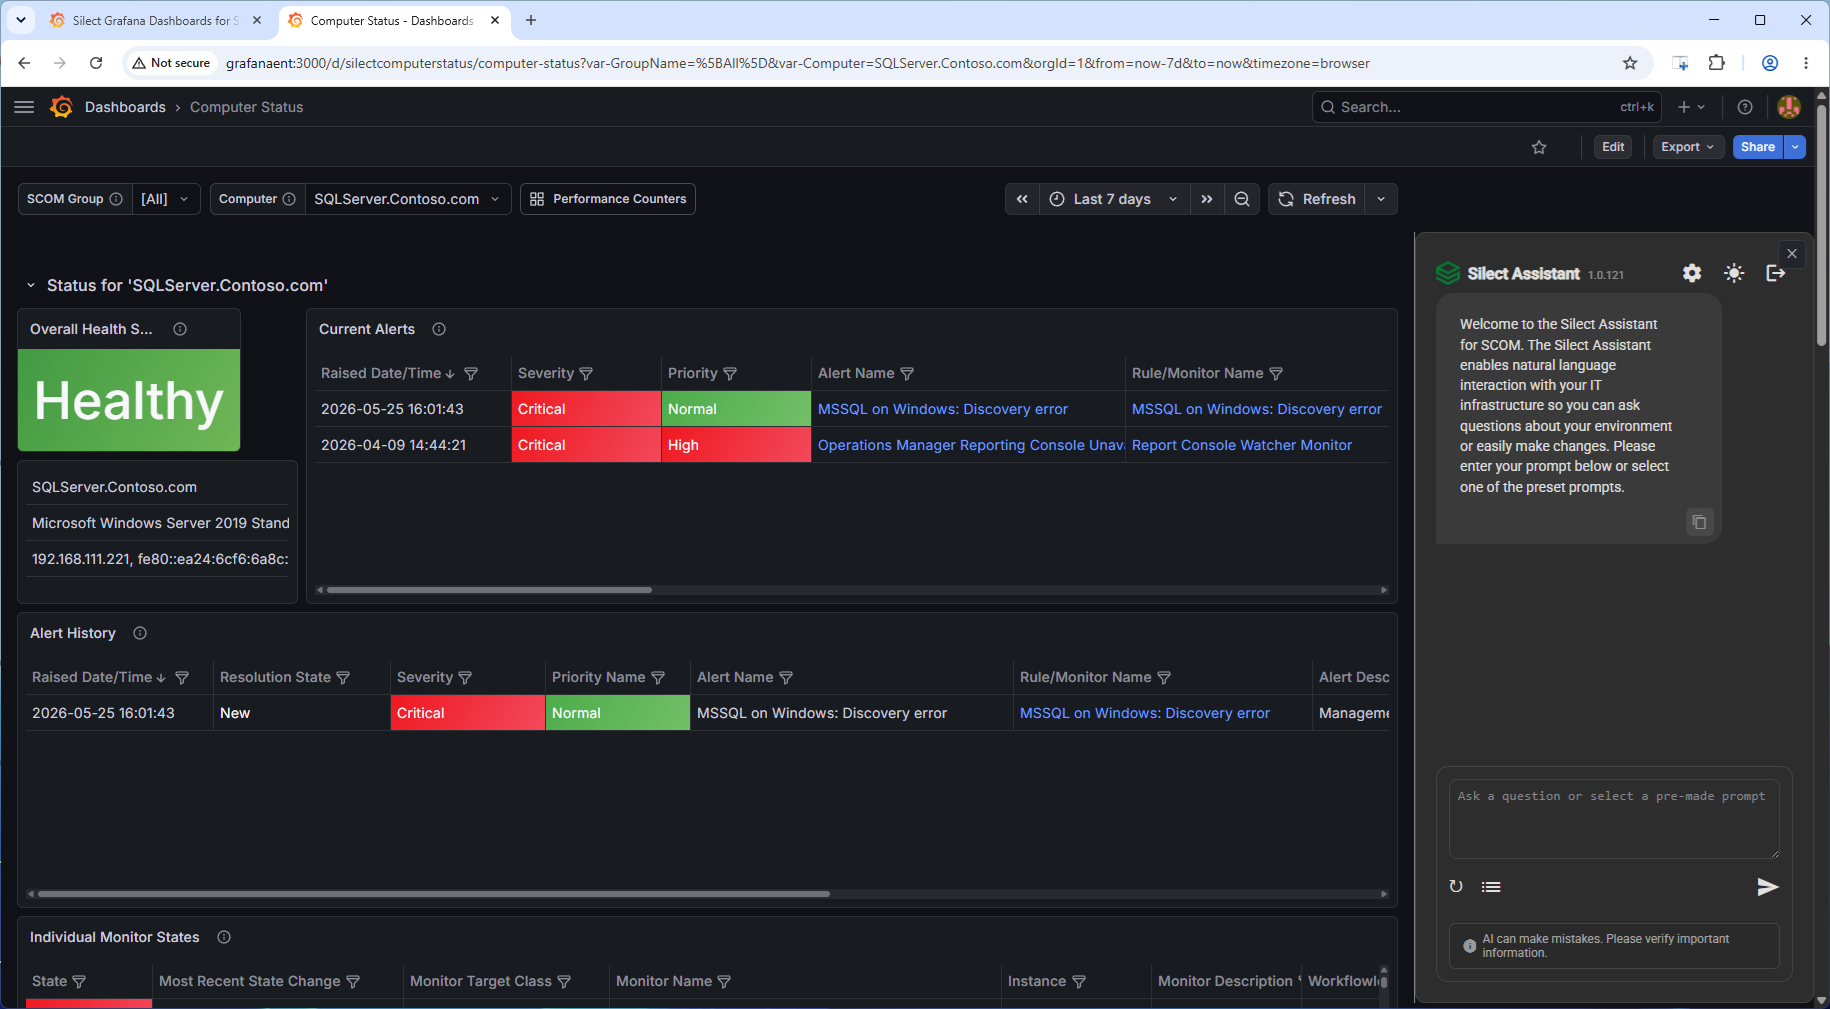
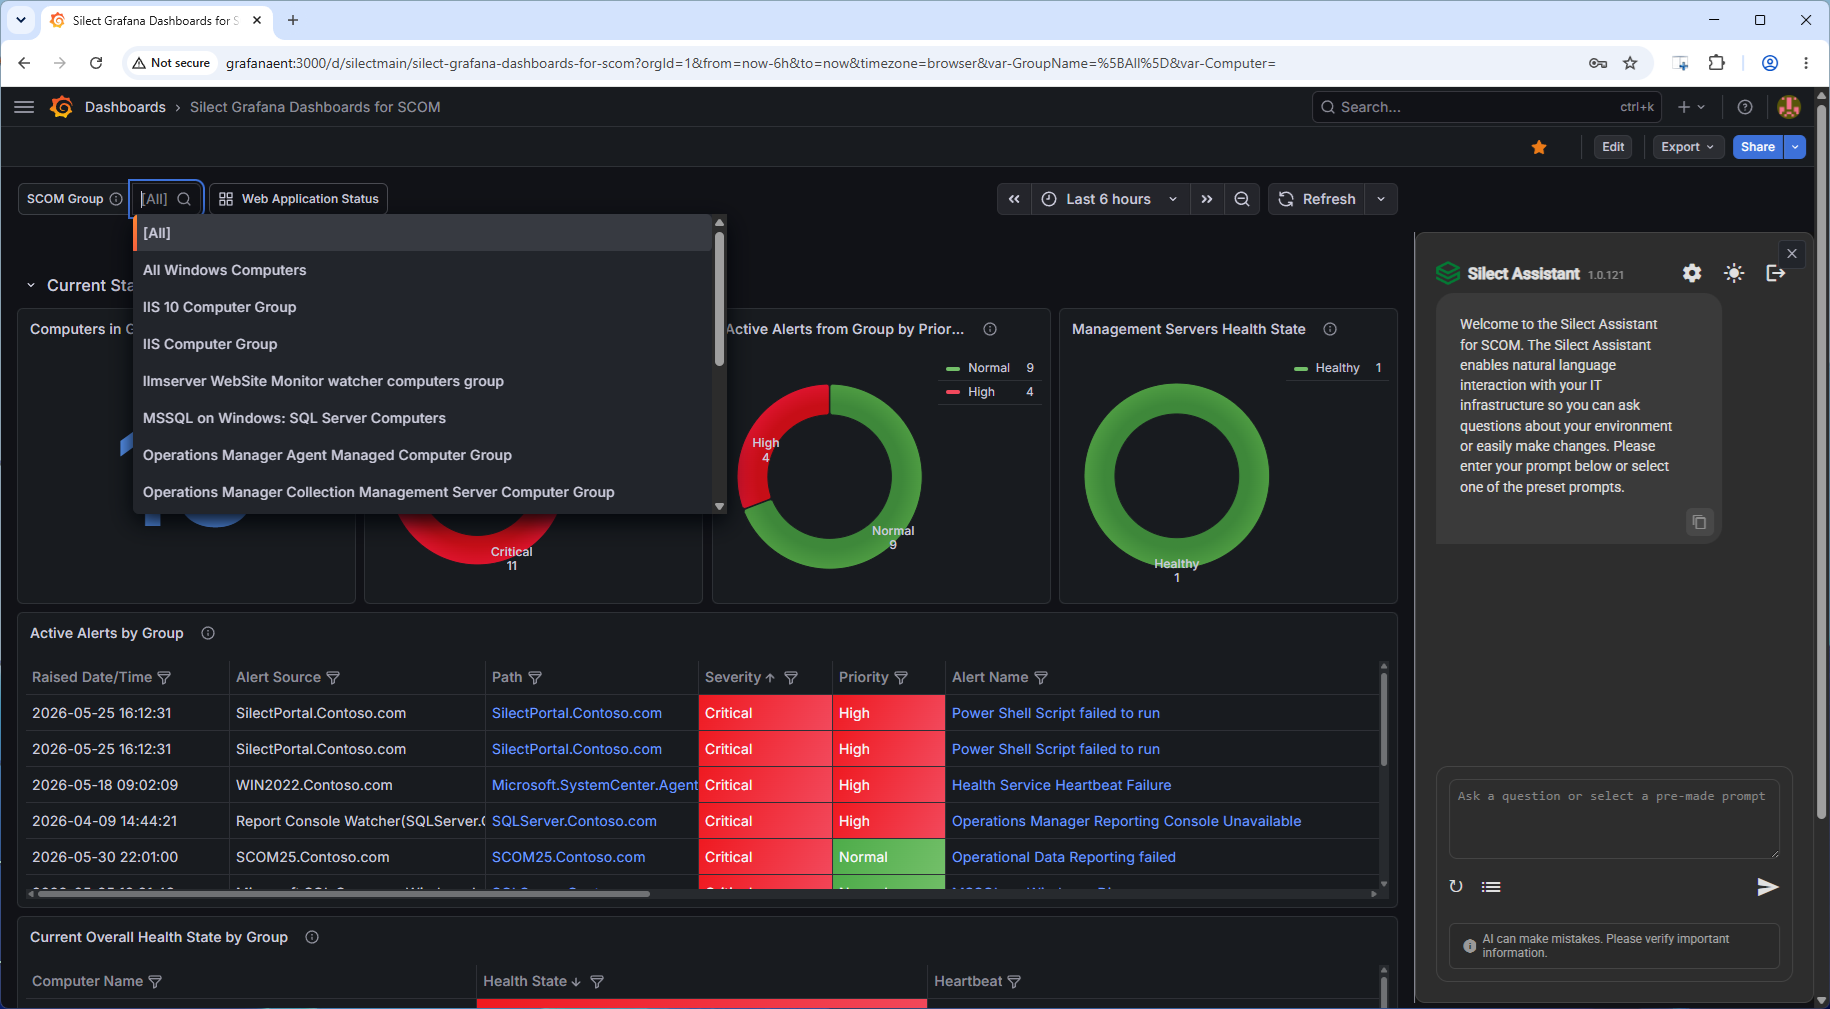
Silect Grafana Dashboards for SCOM transform traditional monitoring data into rich, real-time visual insights by seamlessly integrating System Center Operations Manager with the modern Grafana analytics platform. These dashboards provide IT operations teams with intuitive, highly customizable views of performance metrics, alerts, and infrastructure health across their entire environment, enabling faster troubleshooting, improved trend analysis, and more informed decision-making. By leveraging Grafana’s powerful visualization capabilities alongside SCOM’s deep monitoring data, Silect delivers a more flexible and scalable reporting experience that enhances operational visibility while reducing reliance on legacy SCOM consoles and reports.
The Grafana Dashboards for SCOM are now completely FREE!
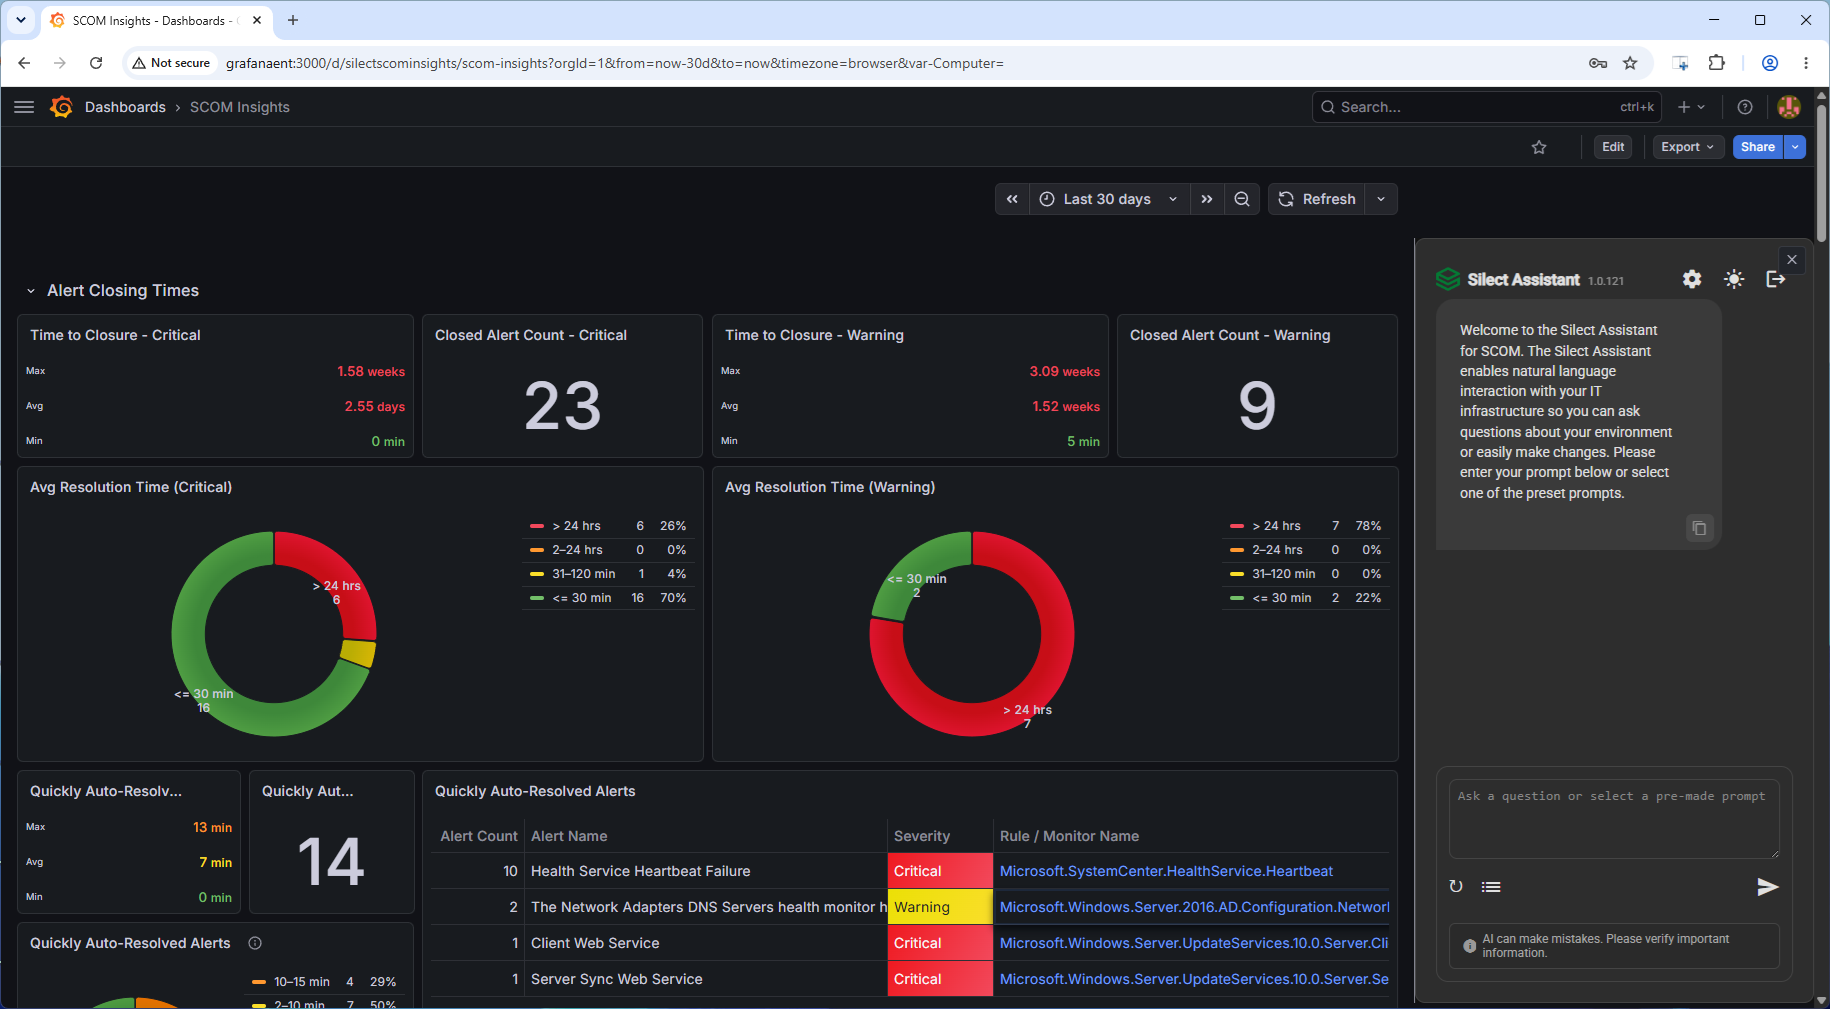
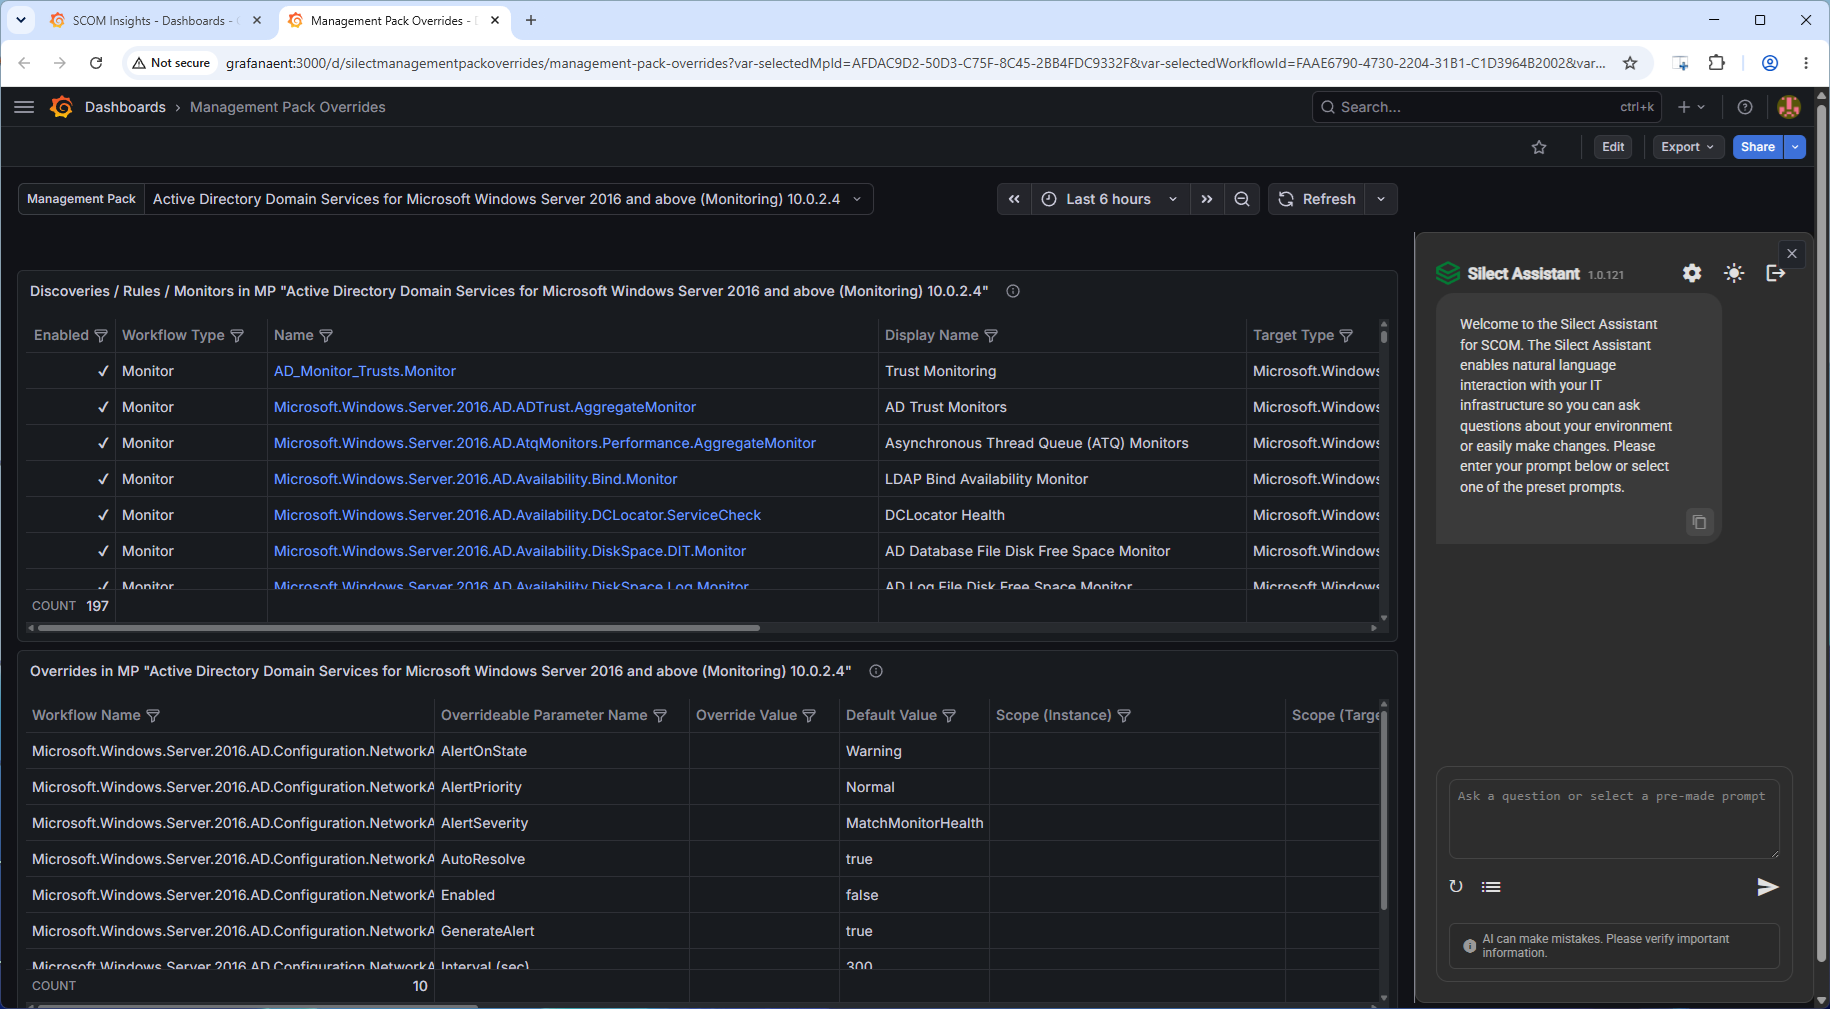
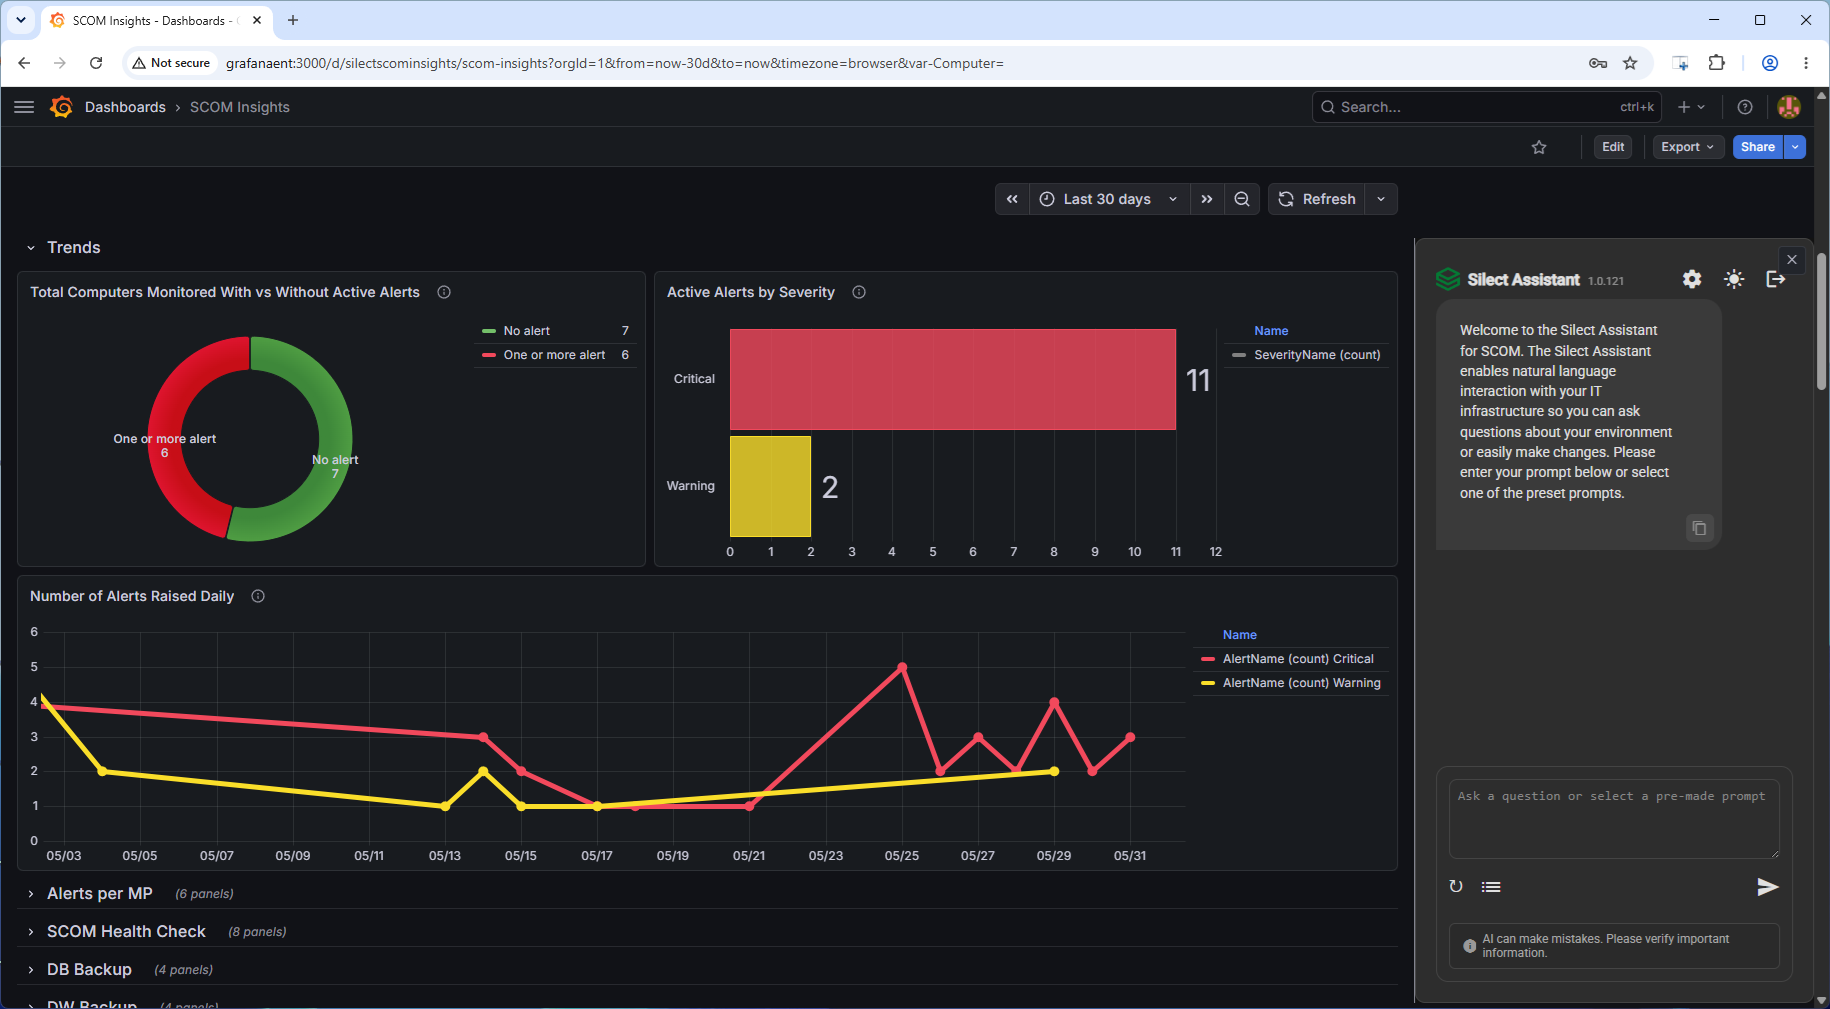
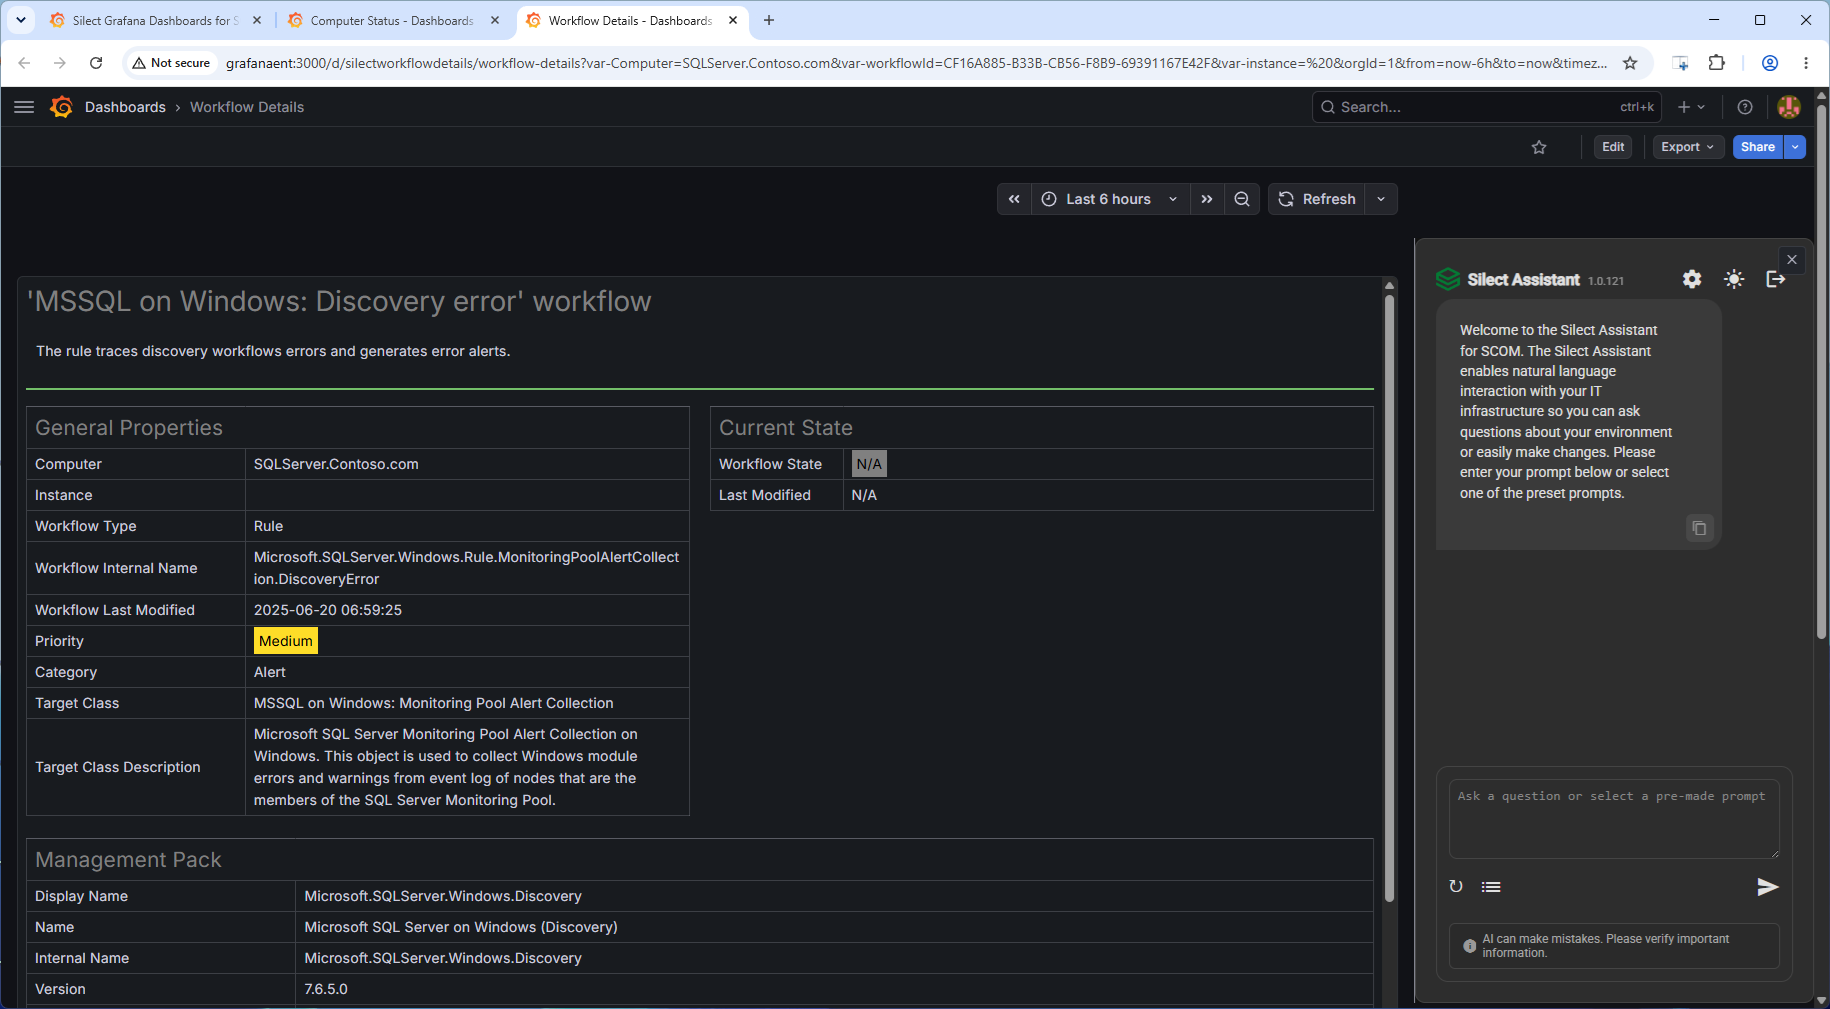
The new dashboards include support for the new Silect Assistant to turn your dashboards into a full control center for your IT infrastructure.